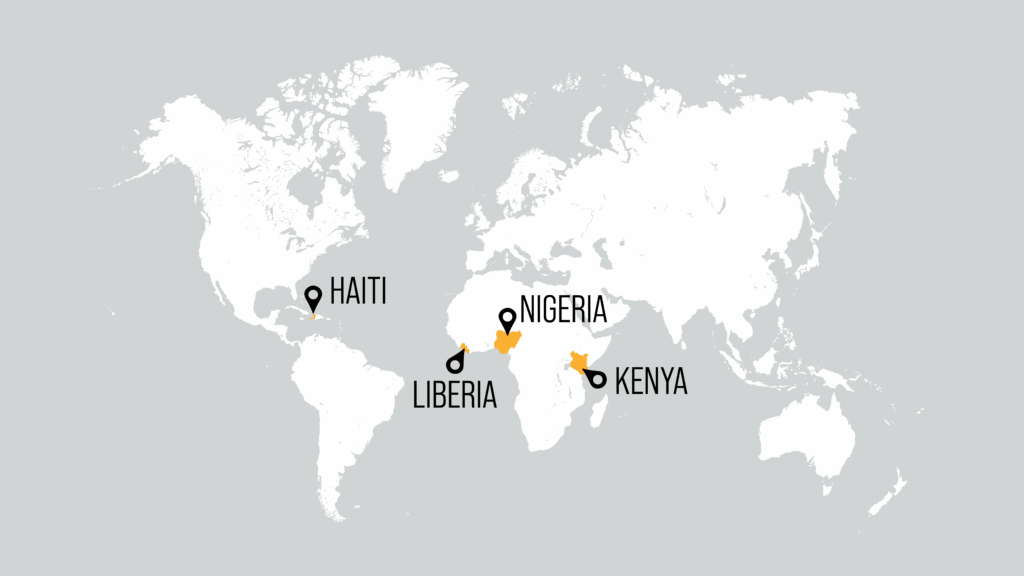
Take a look at our calendar and see what events are happening and how you can get involved with Lifewater Canada!
Check out our June 2026 Townhall.
Hear Lawrence, the Lifewater Liberia board treasurer speak about his vision for Lifewater moving forward.
View our annual audited financial statements and learn how we are invested in our work.
Read the most recent news from Lifewater Canada.
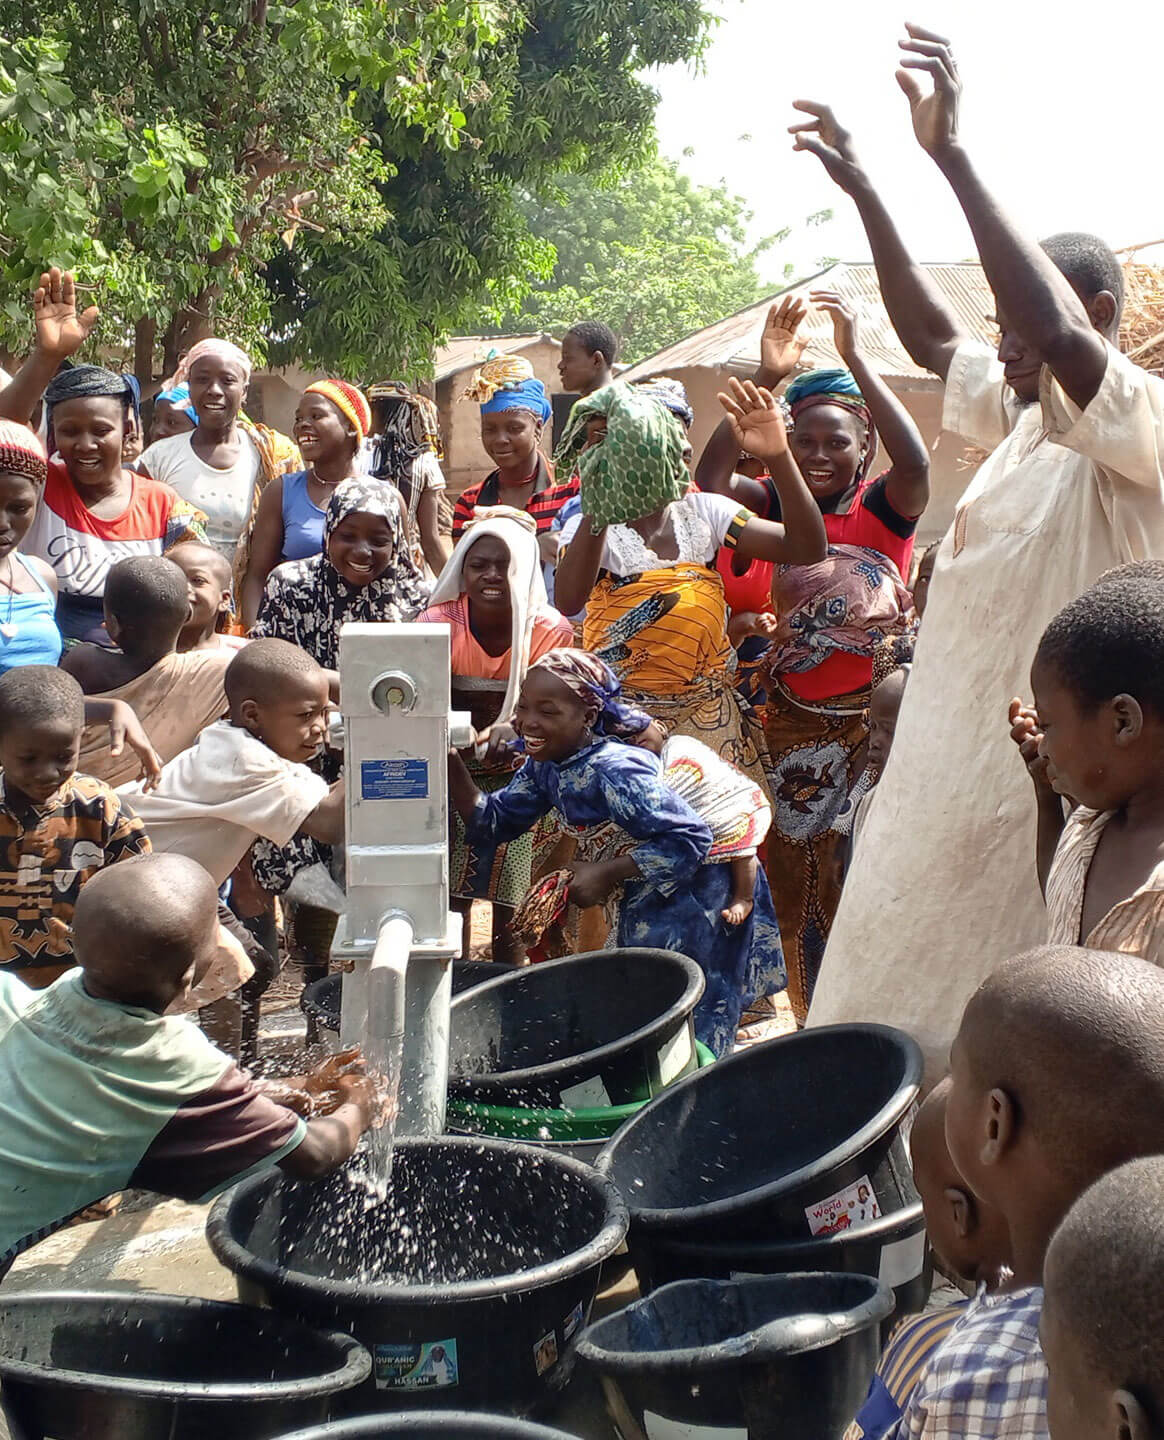
First, we train and equip local teams in 6 areas of water, sanitation, and hygiene (WASH) programs like well drilling and pump repairs.
Second, these local teams complete projects and engage community members, creating ownership through involvement.
Third, support from donors make projects affordable.
Local, empowered leaders keep safe water flowing and break the cycle of poverty by building lasting strength from within.
It all started with a discouraging diagnosis and one trip to Liberia over 30 years ago…
Without clean water, sanitation and hygiene; disease spreads, poverty grows, and opportunity disappears, especially for women and children.
Your support makes a difference.